
The Triple Billion targets
A visual summary of methods to deliver impact
“Our vision remains the same as it was when we were founded in 1948: the highest attainable standard of health for all people. But the world has changed, which is why we have articulated a new mission statement for what the world needs us to do now: to promote health, keep the world safe and serve the vulnerable.”
Dr Tedros Adhanom Ghebreyesus, WHO Director-General
Two words – measurable impact – are at the heart of WHO’s plans to transform the future of public health. The focus is on using timely, reliable, actionable data to improve the health of billions of people. The Triple Billion targets are fundamental to how this plan will be achieved and monitored.
These targets are both a measurement tool and a strategy to deliver: one billion more people benefitting from universal health coverage, one billion more people better protected from health emergencies and one billion more people enjoying better health and well-being.
Perhaps more than anything, they represent a new way of thinking. The outcome of the Triple Billions is a tangible number. A number relatable to human lives. A number that can drive change.
Crucially, the Triple Billions help countries to deliver on the Sustainable Development Goals (SDGs). The Billions are calculated using three composite indices based on the SDGs. Aligning with the SDGs makes sense: it reduces the burden of data collection on countries and accelerates progress. Achievement in one means achievement in the other.
The Triple Billion indices use a sub-set of 46 outcome indicators. These include 39 SDG indicators and seven Member State-approved indicators covering a range of key health topics. The 46 outcome indicators will be used, whenever applicable, to measure within-country inequality.
An overarching and comparable measure of the impact of the Triple Billion targets is healthy life expectancy (HALE) – an indicator that provides a summary measure of average levels of population health. It quantifies expected years of life spent in good health and will be used for baseline reporting and Member State progress tracking.
There are many aspects to this shared work: setting goals, tracking progress and problem-solving, while constantly learning and sharing best practices to ensure no one is left behind. But everything leads to one common goal – delivering impact in countries.
.jpg?sfvrsn=4da8e8f0_4)
Two women register patients at a healthcare facility in Nepal.
Universal health coverage
Target: 1 billion more people benefitting from universal health coverage without financial hardship
Two key components combine for us to measure the universal health coverage index: coverage of essential health services (SDG 3.8.1) and financial hardship (SDG 3.8.2).
Coverage of essential health services (known as average service coverage or ASC) is made up of 14 indicators* in four categories. Financial hardship is the proportion of the population that spends more than 10% of household income on health.For universal health coverage to improve, both of these components must improve. It is not enough for us to make progress in average service coverage yet see financial hardship worsening over time.
We calculate a single value for universal health coverage that estimates the percentage of services received without incurring financial hardship. This is done by multiplying average service coverage with the proportion of the population without financial hardship (1 - financial hardship).
We can now take the change in this value between 2023 and 2018 and multiply it by the global population in 2023. This gives us the number of people that makes up the universal health coverage billion.
*Coverage of essential health services (SDG 3.8.1): Antenatal care, Child pneumonia, Family planning, Immunization, Diabetes, Hypertension, Tobacco, HIV, Malaria, TB, WASH, Beds, Health workforce and IHR.
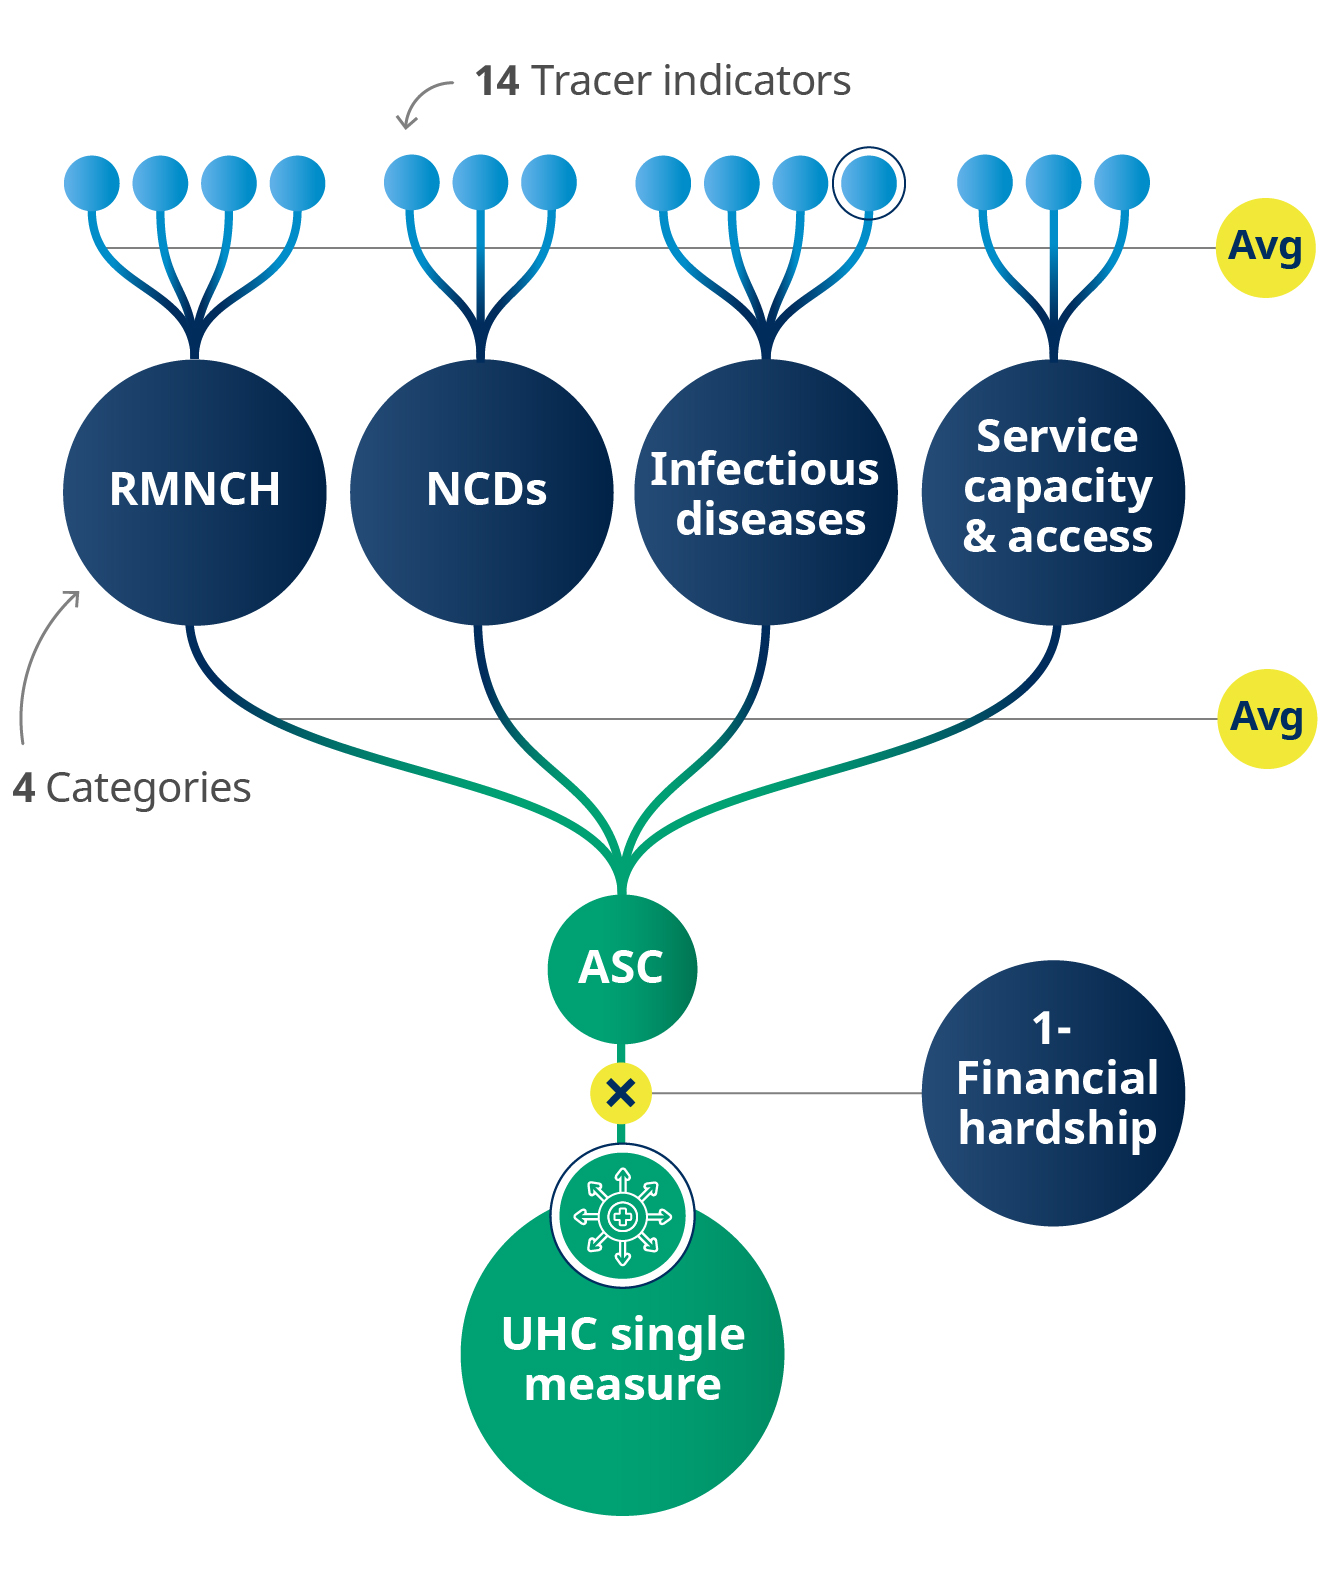
Notes: 1. Sometimes there may be 13 tracer indicators used rather than 14 as the malaria indicator under infectious diseases is only relevant in some countries. 2. RMNCH: Reproductive, maternal, newborn and child health. 3. NCD: Noncommunicable diseases.
.jpg?sfvrsn=2e8ffaf_19)
A child receives a blood test in Quartier Galabadja V near Bangui, Central African Republic, following an alert on suspected chickenpox cases.
Health emergencies protection
Target: 1 billion more people better protected from health emergencies
There are three parts that measure the health emergencies protection index:
1. Emergency preparedness (Prepare) (SDG 3.d.1)
2. Emergency prevention (Prevent)
3. Emergency detection & response (Detect & respond)
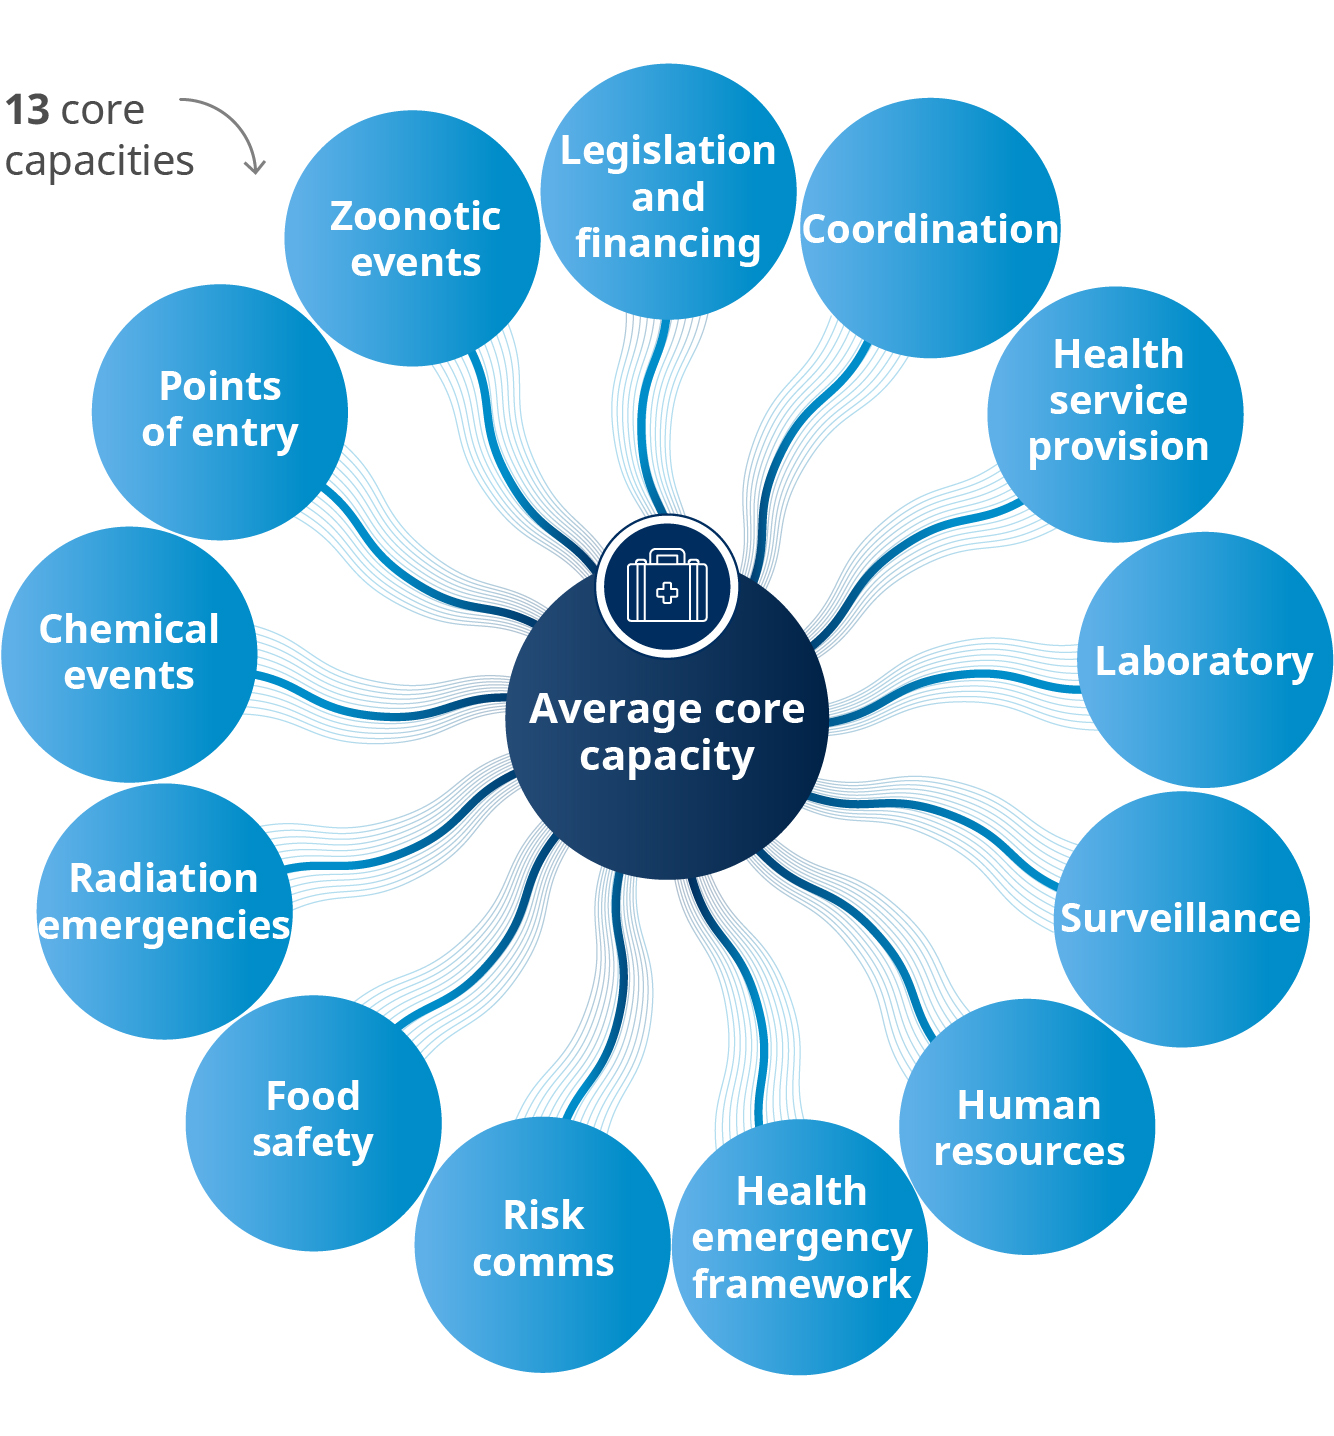
The Prepare indicator is the average of the 13 core capacities of the International Health Regulations (IHR), which helps countries build their capacities to detect, assess and report public health events.
The Prevent indicator measures the average vaccine coverage for selected diseases.
For each country, the indicator uses only those vaccine coverages that are relevant. For example, measles and polio vaccines are relevant for all Member States, but the yellow fever vaccine is relevant only for countries at risk from yellow fever.
Vaccination coverage measures the percentage of the target population that has received the recommended dose of vaccine.
We calculate the average vaccine coverage, including all routine vaccinations and any additional vaccination campaigns. The average is weighted, meaning it gives more emphasis to vaccinations that apply to large groups of people.
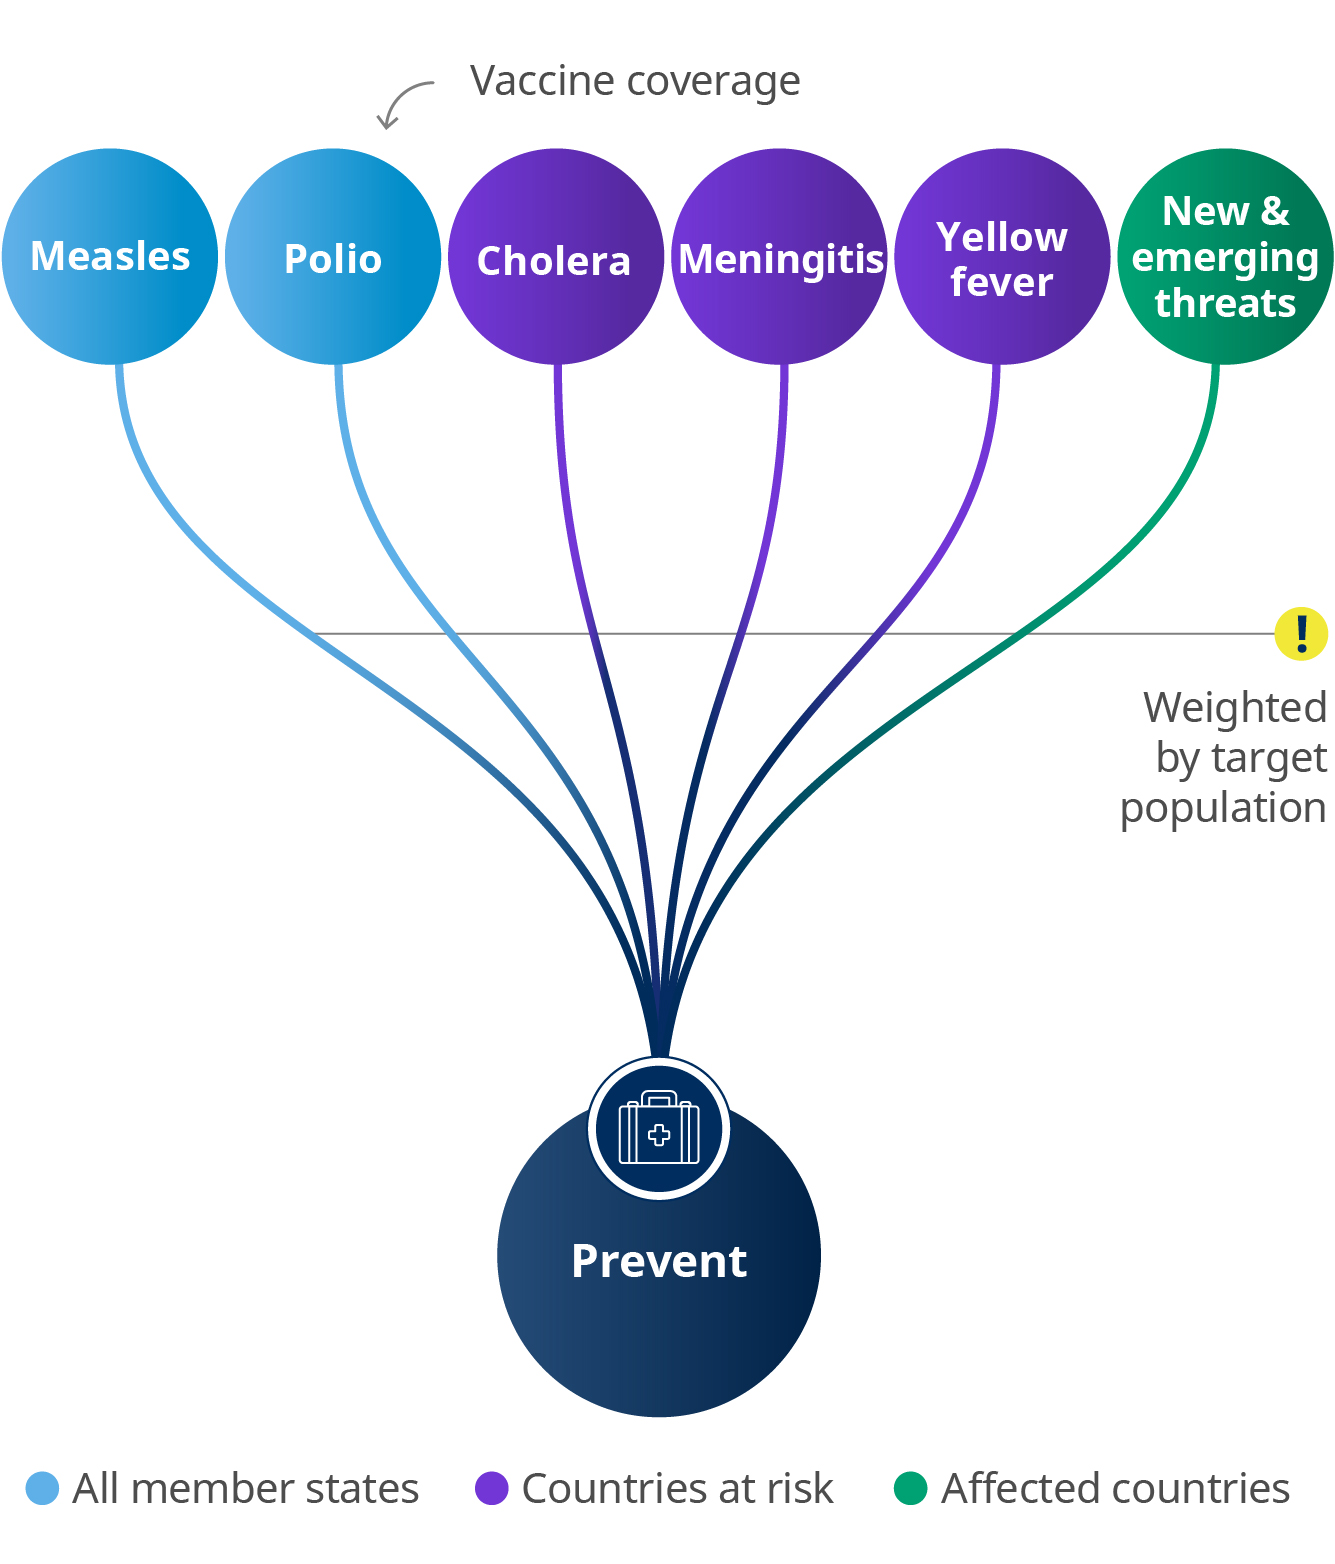
Note: Vaccine coverages could include coverages of campaign and routine vaccinations.
The Detect & respond indicator comprises three components related to events with serious public health impacts. They monitor the timeliness of detection, notification and response.
Based on how quickly a country acts during each event, we give each timeliness component a score from within a day (Level 5, the best score) to over two weeks (Level 2), or even no data (Level 1, the worst score).
Then for each event, the three timeliness levels are averaged, giving us an overall level for each event. Finally, we average the overall level of all events in the last five years and multiply by 20 to get a number between 0 and 100.
.jpg?sfvrsn=e78cb9ec_8)
We now have three numbers representing overall scores for Prepare, Prevent and Detect & respond.
To calculate the billion, first we estimate the number of people who benefit from Prepare and from Prevent. For both these indicators, this is the change in the value between 2018 and 2023 multiplied by the 2023 global population.
Detect & respond is a new indicator and is measured using a five-year average so we can’t yet calculate change. For this indicator, we will add in a specified percentage of the population dependent on the score a country is given for its capability in Detect & respond. This number is then multiplied by the 2023 global population.
To work out the final contribution to the health emergencies protection billion, the three values for Prepare, Prevent and Detect & respond are totalled to give the number of people better protected from health emergencies.
.jpg?sfvrsn=acf545d2_4)
Underprivileged children in India take part in free yoga classes run by NGO Harmony House.
Healthier populations
Target: 1 billion more people enjoying better health and well-being
The healthier populations billion is measured using a range of indicators that reflect factors which impact health – but which are not in themselves health services. These 16 indicators* cover a range of topics including clean air and water, safe roads, child nutrition and domestic violence. All but two of them are SDG indicators.
As you might expect, these varied indicators are measured in different ways. For example, some are a percentage while some are a rate such as per 100 000. To allow us to count changes in healthiness, we begin by transforming all 16 into percentages.
Each healthier populations indicator is also only relevant to a specific population. For example, the stunting prevalence indicator is only relevant to children under 5 years of age, whereas the tobacco use indicator relates specifically to persons aged 15 years and older.
To calculate the billion, we need to find the number of healthier people for each of the 16 indicators. To do this we work out the difference in prevalence between 2023 and 2018 for each indicator. Then we multiply this difference with the indicator’s relevant population in 2023.
Once we have the number of healthier people for each of the 16 indicators, we can add them up to calculate the total contribution to the healthier populations billion. We make a simple adjustment in case some people have benefitted more than once.
This is the total number of people enjoying better health and well-being.
*Stunting among children under 5 (SDG 2.2.1), Overweight children under 5 (SDG 2.2.2), Wasting among children under 5 (SDG 2.2.2), Suicide mortality (SDG 3.4.1), Harmful use of alcohol (SDG 3.5.2), Death rate due to road traffic injuries (SDG 3.6.1), Tobacco use (SDG 3.a.1), Children under 5 who are developmentally on track (SDG 4.2.1), Partner violence against women (SDG 5.2.1), Safely managed drinking water (SDG 6.1.1), Safely managed sanitation services (SDG 6.2.1), Primary reliance on clean fuels and technology (SDG 7.1.2), Ambient air quality (SDG 11.6.2), Violence against children (SDG 16.2.1), Obesity (WHA 66.10) and Trans fats policy (WHA 66.10).
.jpg?sfvrsn=5aa0cbb_6)
Conclusion
The Triple Billion targets are specifically designed to get us working together and to give WHO, Member States and partners a clear focus on a common goal. More than a vital mechanism to measure progress, they are a powerful catalyst for achieving the SDGs and, ultimately, a healthier world.
Measuring the Triple Billion targets encourages strengthened data collection and monitoring, and highlights the considerable gaps in public health data that still exist in many parts of the world. Delivering the targets means we have to understand and address these gaps. We also must look beyond the numbers and recognize what impact this can have for communities, families and individuals. It is ultimately the people we serve, and the people we look out for.
Improved data is key to achieving the Triple Billions and the SDGs. With this data we can identify strong performances, share the best practices it took to reach them, spot early barriers to progress and help others problem-solve. The Triple Billion indices will continue to evolve and adapt to ensure they are fully relevant to the current situation. WHO remains committed to supporting and strengthening countries’ data capacity and fortifying their ability to use data in driving targeted policy action.
Tracking and using this data is the launchpad for accelerating improvements to deliver public health and help countries provide meaningful change to all people. Together we can promote health, keep the world safe and serve the vulnerable.