
Annex
Methodology for WHO’s second investment case
Annex. Methodology for WHO’s second investment case
WHO’s second investment case presents two main pieces of data related to returns on investment:
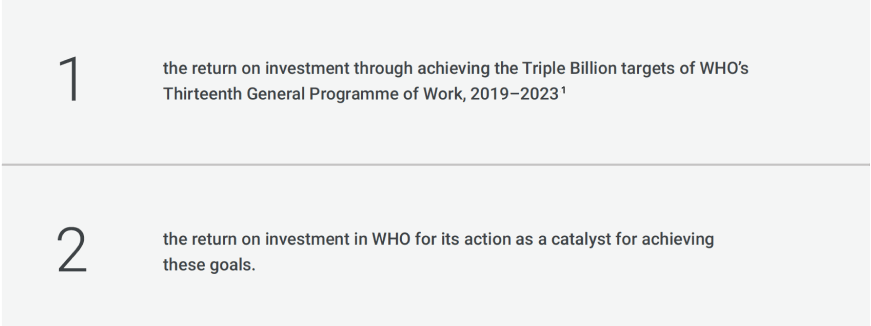
This annex outlines the methodology underpinning each of these sets of data. More detailed methodology of each analysis is available.²,³
WHO’s second investment case presents two main pieces of data related to returns on investment:
WHO’s Thirteenth General Programme of Work, 2019–2023 aims to ensure that an additional one billion people benefit from universal health coverage, one billion more people are better protected from health emergencies, and one billion more people enjoy better health and well-being by 2023.¹ The General Programme of Work was conceptualized before the COVID-19 pandemic, which has caused widespread disruptions to essential health services, increasing delays in achieving these targets. The proposed extension through to 2025 is at the time of writing awaiting consideration from the Seventy-fifth World Health Assembly in May 2022.
WHO’s first investment case “A healthier humanity: the WHO investment case 2019–2023” ⁴ reported the economic case for attaining the targets of the General Programme of Work. The full methodology was published in an accompanying technical report “Investing global, investing local: supporting value for money towards the health SDGs” ⁵ by the WHO Secretariat. This second investment case refers to these same data and methodology.
The analysis underlying the first investment case used a compilation of existing models and publications, with adjustments made as appropriate. The authors began by identifying the estimates of costs and benefits of scaling up interventions for each of the Triple Billion targets in the 2019–2023 timeframe, focusing on low- and middle-income countries where the global burden of disease is mainly concentrated and where progress towards universal health coverage is required. Efforts were made to avoid double counting and to exclude studies lacking the requisite methodological detail. The costs required to achieve each of the billion targets in the first investment case are the sum of the financial costs of implementing interventions in a specific year, for each area, above what would be spent at established baseline levels – that is, the additional investment need.
Each investment is associated with a health impact. Health benefits are measured as health outcomes only (expressed as lives saved), and not converted into monetary values. With regard to the investments needed to reach universal health coverage, the health benefits are also expressed as healthy life years gained, and as a summary measure, increases in life expectancy.
The analysts also identified the economic gains expected from the scale-up of interventions. Because the economic gains attributable to some investments in the five-year period of the General Programme of Work will continue to accrue beyond 2023, they are taken into account where published estimates existed. Investments leading to “cost savings” are presented as “cost offsets” but were not added to the other estimated gains.
Calculating the attribution of benefits to investment in WHO
The analysis presented here is the first attempt to determine the economic and social return on investing in WHO now. It advances the work presented in the first investment case, which identified the investment and returns at the global level. We now look at attributing benefits at the country level to investments made in WHO across all its three levels.
The methodology follows three major steps: estimating the global public benefits, attributing those benefits to WHO and estimating the benefit-cost ratio.
Estimate of global benefits
Estimates of the benefits created by the scaling up of more than 100 WHO-recommended interventions were identified in the literature. The public benefit created by each intervention is calculated using disease-specific deterministic projection models and varying the coverage values from the current level to a higher level aligned with reaching the health-related Sustainable Development Goals or other targets. The size of the impact associated with each intervention is taken from the literature, largely composed of systematic reviews of randomized controlled trials. The attributable health benefits are defined as the difference between the health outcomes in two scenarios: scale-up of coverage and business as usual. For each of these interventions, the health benefits measured in lives saved and healthy life years gained were drawn from the published studies for the time period 2022–2031, that is, over a 10-year period from now. The public benefit is then adjusted for an achievement rate to account for over optimistic scale-up scenarios, such as those which assume achievement of Sustainable Development Goal indicators by 2030.
Benefits attributed to WHO
As WHO works with national governments and other partners such as other United Nations organizations (for example the United Nations Population Fund (UNFPA), global health partnerships (for example Gavi, The Vaccine Alliance and the Global Fund to Fight AIDS, TB and Malaria) and nongovernmental organizations, the share of public benefit that can be attributed to WHO is then identified through the development of an attribution rate. The share of returns attributable to WHO will likely vary across WHO’s spheres of activity, depending on the nature of those activities in a given area, and the skills, expertise and communications capability that WHO brings relative to that of other parties involved in that area.
Using the three strategic shifts identified in the Thirteenth General Programme of Work, combined with seven normative functions that WHO performs, the common set of influencing tools used by WHO to achieve public benefit at the country level can be identified (Table 1).
Table 1. WHO’s strategic shifts and associated influencing tools
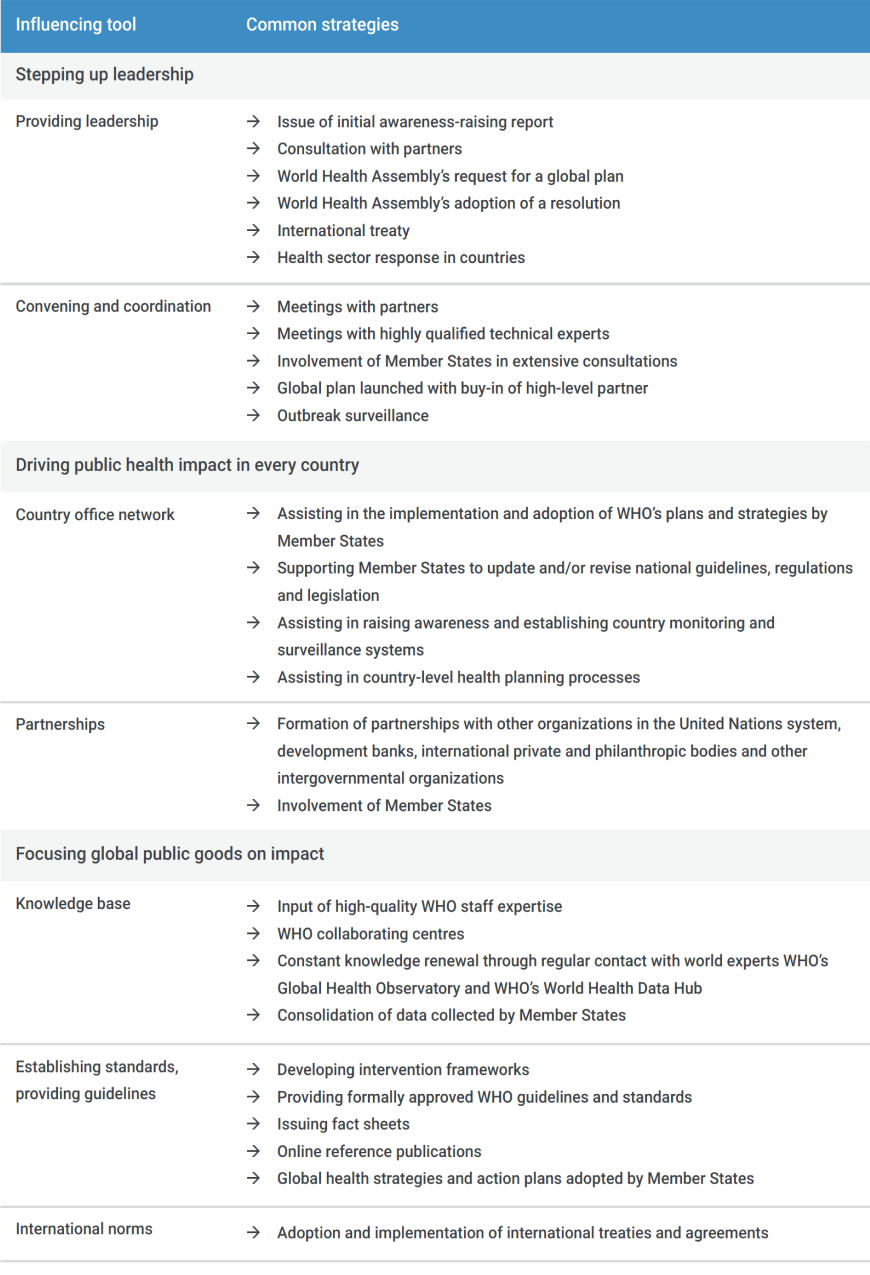

The estimated benefits reflect the total health-system outcomes for only a proportion of WHO’s activities. It is not possible to estimate WHO’s full value owing to absence of data and the limitations of modelling. However, based on comparability across those areas included using the common method, the analysts expect that the methodology can apply across all health areas addressed by WHO. The additional benefits attributable to WHO depend on the resources allocated to the use of the influencing tools identified by WHO, and ultimately, the value of the health outcomes generated by the proposed intervention programmes in each of these additional areas.
To calculate the attribution rate for each area of activities, two methods were used:
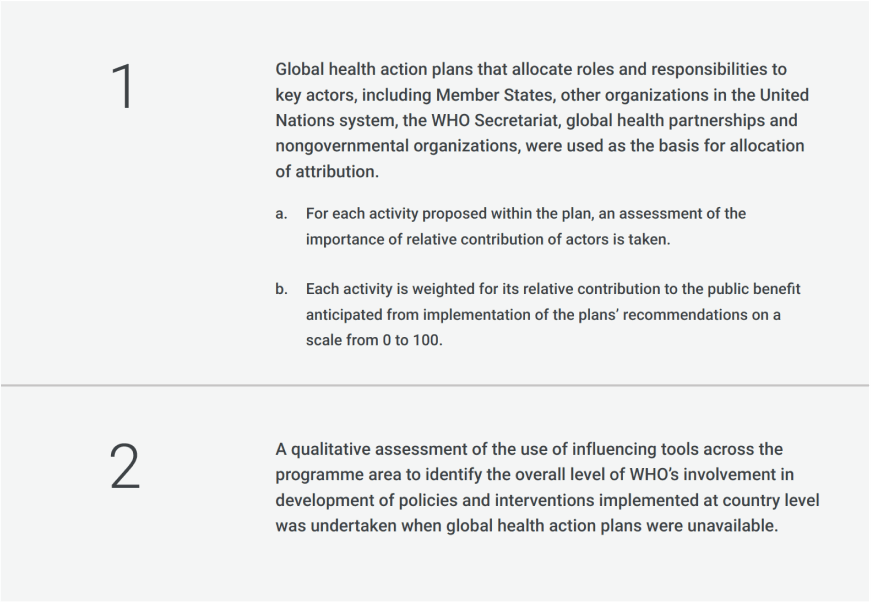
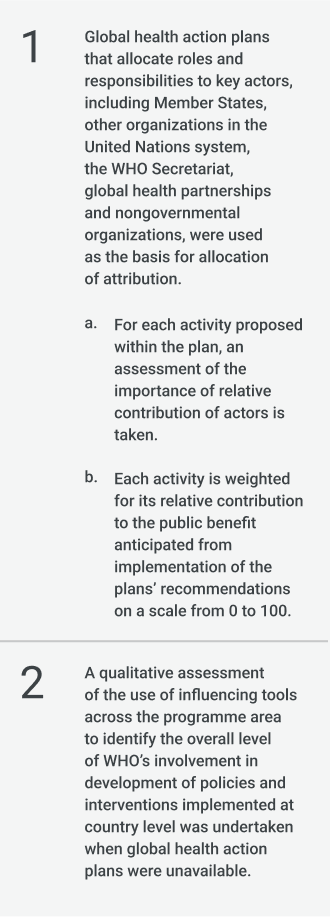
The global health action plan methodology was used for three areas: mental health (7.5–14%),⁶ noncommunicable diseases (5.0–7.5%) and road safety (5.0–7.5%). The value of the influencing tools were assessed for non- COVID-19 vaccines (7.5% attribution rate), pandemic preparedness (15–20%) and reproductive, maternal, newborn child and adolescent health (7.5–10%), and prevention of child marriage (3–5%).
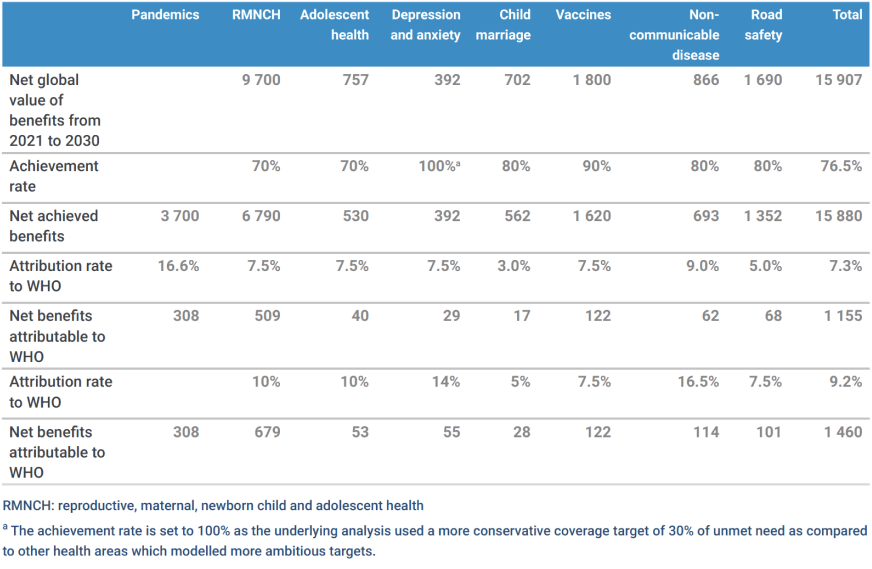
Table 2 summarizes the results for the more than 100 interventions considered above. The first line presents the results emerging from the models for the global value of the benefits created in each area, expressed as net present value at a discount rate of 3% per annum. The total figure of the public value at the global level which WHO contributes to over the 109 interventions (excluding pandemic management) amounts to US$ 15.9 trillion.
Two critical variables influence the calculation of the net benefits attributable to WHO: the achievement rate and the attribution rate. The first, the achievement rate, represents the extent to which it is reasonable to assume that the target level of outcomes in the studies used as a basis for these estimates can be achieved. For an investment case, as it is not appropriate to use high target levels for interventions and outcomes that may not be achievable in practice, modelled public benefits have therefore been adjusted to reflect the probability of achieving coverage targets. The second is the attribution rate, for which lower and upper bounds have been calculated to reflect the uncertainty in this area.
The weighted average attribution rates are 7.3% (lower) and 9.2% (higher), giving respectively a net present value of public benefits attributable to WHO of US$ 1.155 trillion and US$ 1.460 trillion. Both of these figures are net present values at a 3% discount rate. Owing to the high level of uncertainty in this attribution analysis, the lower bound is used as the base case for the calculation of the return on investment in WHO. This lower estimate corresponds to an average attribution rate of 7.3% over the more than 100 interventions studied and translates to US$ 1.155 trillion out of the net global public benefits of US$ 15.9 trillion attributed to WHO’s activities.
Table 2. Attribution of public benefit created by implementation of WHO influencing tools to WHO

Calculating the return to investing in WHO
The central cost case for the investment analysis starts from the latest Programme budget for WHO for the biennium 2022–2023, which already incorporates some allowance for strengthening WHO’s activities. Biennial budgets are assumed to increase in real terms by 10% per biennium after that for 2022–2023. This figure is nearly equal to an increase of 5% per annum, which aligns with the findings of WHO’s 2021 global health financing report,⁷ indicating that over the past two decades health spending has more than doubled, representing an average 5% increase per year. The total level of funding available to WHO over the period 2021–2030 was then calculated as the net present value of this funding stream at a discount rate of 3% per annum. On this basis, the net present value of future funding over the decade is US$ 33 billion.
With a net present value of the investment cost of US$ 33 billion, the benefit-cost ratio for the benefit estimates in Table 2 are 35.0–44.3. The lower bound of this estimate, 35.0, is taken as the base-case finding meaning that for every US$ 1 invested in WHO US$ 35 is returned in attributable benefits. This is a lower-bound estimate because, although the full cost of investment in WHO is included in the denominator, only a proportion of the relevant activities of WHO have been included in the calculation of benefits in the numeration. Even so, a return of US$ 35 for every US$ 1 invested is very high, representing excellent returns on investment.
In sum, the expected budget investment of US$ 33 billion in WHO over the coming decade is expected to contribute to generating net global public benefits of US$ 15.9 trillion, of which at least US$ 1.155 trillion would be directly attributable to the actions of WHO. This means for each US$ 1 invested a minimum return of US$ 35 in public benefit would be achieved.
- Thirteenth General Programme of Work, 2019–2023: promote health, keep the world safe, serve the vulnerable. Geneva: World Health Organization; 2019 (WHO/PRP/18.1; https://apps.who.int/iris/handle/10665/324775/).
- Investing global, investing local: supporting value for money towards the health SDGs. Geneva: World Health Organization; 2018 (WHO Working Paper; https://www.who.int/docs/default-source/investment-case/value-for-money.pdf).
- WHO investment case 2.0: technical report. Melbourne: Victoria Institute for Strategic Economic Studies; 2022 ( https://www.vu.edu.au/sites/default/files/who-investment-case-technical-report-march-2022.pdf).
- A healthier humanity: the WHO investment case for 2019–2023. Geneva: World Health Organization; 2018 (WHO/DGO/CRM/18.2; https://apps.who.int/iris/handle/10665/274710).
- Investing global, investing local: supporting value for money towards the health SDGs. Geneva: World Health Organization; 2018 (WHO Working Paper; https://www.who.int/docs/default-source/investment-case/value-for-money.pdf).
- Numbers in parenthesis present the range of attribution percentages calculated for each area.
- Global expenditure on health: public spending on the rise? Geneva: World Health Organization; 2021 ( https://apps.who.int/iris/rest/bitstreams/1400583/retrieve, accessed 17 March 2022).
